PySpark Dataframe DSL basics
In this blog post, I explore the PySpark DataFrame structured API and DSL operators.
Typical tasks you can learn:
- Connection to remote PostgreSQL database
- Create DataFrame from above database using PostgreSQL Sample Database
- Create DataFrame using CSV (movieLens) files.
In addition to that the equivalent SQL has been provided to compare with the DSL.
Preperation
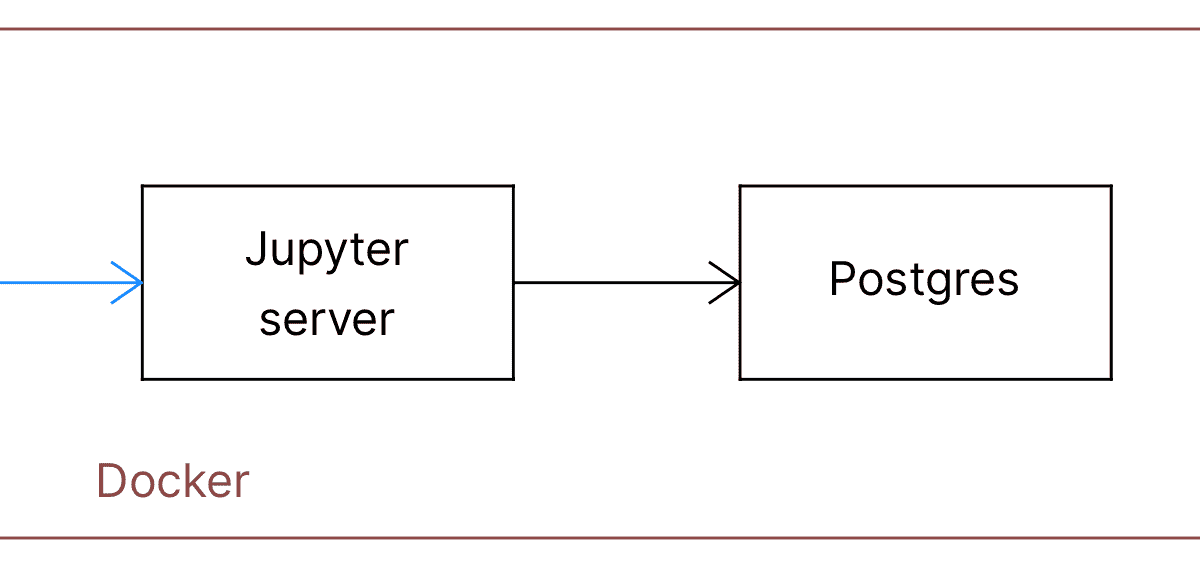
Setup the the environment mentioned in the blog post PySpark environment for the Postgres database1 to execute the following PySpark queries on the Postgres Sample Database2.
from pyspark.sql import SparkSession
spark = SparkSession.builder.appName("Postgres Connection") \
    .config("spark.jars", # add the PostgresSQL jdbc driver jar
            "/home/jovyan/work/extlibs/postgresql-9.4.1207.jar").getOrCreate()
As shown in line# 4, I am using JDBC driver which is in my local macOS volume mapped ("$(pwd)":/home/jovyan/work) to the Jupyter docker container as explained in the above blog post.
If you are using Windows 10, use the following two bash commands to create PostgreSQL and Jupyter containers. For example,
For the Postgres
docker run -t -i --name postgres --rm -p 5432:5432 -e POSTGRES_PASSWORD=ojitha -v ./data:/var/lib/postgresql/data postgres:13.4
and for the Jupyter:
docker run --name pyspark -ti --link postgres --rm -e JUPYTER_ENABLE_LAB=yes -e JUPYTER_TOKEN="pyspark" -v C:\Users\ojitha\workspace\jupyter\data:/home/jovyan/work -p 8888:8888 jupyter/pyspark-notebook
It is important to note that the docker should be installed on the host machine before run the above commands.
You can connect to the Jupyter notebook via the http://<windows host IP>:8888/lab?token=pyspark URL.
Configure Database in the PySpark
Configure the database
- database name
- user/password and driver properties
- JDBC URL
Above configuration, you will reuse every time to create a DataFrame.
db_name = 'dvdrental'
db_props = {"user":"postgres","password":"ojitha","driver":"org.postgresql.Driver"}
url = "jdbc:postgresql://192.168.1.197:5432/%s" % db_name
Create a rental_df DataFrame from the public.rental table, using
above properties.
NOTE: For the host, it is required to provide the Postgres hosted
server's IP address as shown in theURLvariable above.
rental_df = spark.read.jdbc(url=url, table='public.rental', properties= db_props)
First will do, the Spark projections are made with the select() method.
For example:
SELECT rental_id, rental_date, inventory_id
	FROM public.rental LIMIT 3;
In the PySpark:
rental_df.select('rental_id', 'rental_date', 'inventory_id')\
    .show(3, truncate=False)
+---------+-------------------+------------+
|rental_id|rental_date        |inventory_id|
+---------+-------------------+------------+
|2        |2005-05-24 22:54:33|1525        |
|3        |2005-05-24 23:03:39|1711        |
|4        |2005-05-24 23:04:41|2452        |
+---------+-------------------+------------+
only showing the top 3 rows
A filter can be expressed as filter or where:
SELECT rental_id, rental_date, inventory_id, customer_id, return_date, staff_id, last_update
	FROM public.rental
	where customer_id > 322 limit 5;
In the PySpark:
from pyspark.sql.functions import col

rental_df.select('rental_id', 'rental_date', 'inventory_id', 'customer_id', 'return_date', 'staff_id', 'last_update')\
    .where(col("customer_id") > 322)\
    .show(5)
+---------+-------------------+------------+-----------+-------------------+--------+-------------------+
|rental_id|        rental_date|inventory_id|customer_id|        return_date|staff_id|        last_update|
+---------+-------------------+------------+-----------+-------------------+--------+-------------------+
|        2|2005-05-24 22:54:33|        1525|        459|2005-05-28 19:40:33|       1|2006-02-16 02:30:53|
|        3|2005-05-24 23:03:39|        1711|        408|2005-06-01 22:12:39|       1|2006-02-16 02:30:53|
|        4|2005-05-24 23:04:41|        2452|        333|2005-06-03 01:43:41|       2|2006-02-16 02:30:53|
|        6|2005-05-24 23:08:07|        2792|        549|2005-05-27 01:32:07|       1|2006-02-16 02:30:53|
|       10|2005-05-25 00:02:21|        1824|        399|2005-05-31 22:44:21|       2|2006-02-16 02:30:53|
+---------+-------------------+------------+-----------+-------------------+--------+-------------------+
only showing the top 5 rows
SQL to count the distinct number of customers:
SELECT count(DISTINCT customer_id)
	FROM public.rental;
in the PySpark:
from pyspark.sql.functions import count_distinct

rental_df.select('customer_id')\
    .agg(count_distinct('customer_id').alias("no of distinct customers"))\
        .show()
+------------------------+
|no of distinct customers|
+------------------------+
|                     599|
+------------------------+
To list the distinct customer_ids:
SELECT DISTINCT customer_id
	FROM public.rental LIMIT 5;
in the PySpark
rental_df.select('customer_id') \
    .distinct() \
        .show(5)
+-----------+
|customer_id|
+-----------+
|        496|
|        463|
|        471|
|        148|
|        243|
+-----------+
only showing top 5 rows
To rename a column
SELECT DISTINCT rental_id, customer_id as "Customer Id"
	FROM public.rental LIMIT 5;
in the PySpark
rental_df.withColumnRenamed('customer_id','Customer Id') \
    .select('rental_id','Customer Id') \
    .show(5)
+---------+-----------+
|rental_id|Customer Id|
+---------+-----------+
|        2|        459|
|        3|        408|
|        4|        333|
|        5|        222|
|        6|        549|
+---------+-----------+
only showing the top 5 rows
Aggreations
Most common API functions are groupBy() and orderBy. For example, how many times customer has rented DVDs
SELECT customer_id, count(customer_id)
	FROM public.rental
	GROUP BY customer_id
	ORDER BY count DESC LIMIT 5;
The DataFrame API provides descriptive statistical methods like min(),max() and avg(). In the PySpark
rental_df.select('customer_id') \
    .groupBy('customer_id') \
    .count() \
    .orderBy('count', ascending=False) \
    .show(5)
+-----------+-----+
|customer_id|count|
+-----------+-----+
|        148|   46|
|        526|   45|
|        236|   42|
|        144|   42|
|         75|   41|
+-----------+-----+
only showing top 5 rows
DataFrame from a CSV file
You can create DataFrames from CSV, parquet and other formats. However,CVS doesn't hold the schema metadata, but parquet and Hive do. Therefore, in the following example from MovieLens3, it is best practice to define the ratings_schema for the DataFrame.
from pyspark.sql.types import *
ratings_schema = StructType([
    StructField('userId', IntegerType(), False)
    ,StructField('movieId', IntegerType(), False)
    ,StructField('rating', FloatType(), True)
    ,StructField('timestamp', IntegerType(), True)
])
ratings_df = spark.read.csv("/Users/ojitha/datasets/ml-20m/ratings.csv"
    ,header=True, schema=ratings_schema)
ratings_df.show()
+------+-------+------+----------+
|userId|movieId|rating| timestamp|
+------+-------+------+----------+
|     1|      2|   3.5|1112486027|
|     1|     29|   3.5|1112484676|
|     1|     32|   3.5|1112484819|
|     1|     47|   3.5|1112484727|
|     1|     50|   3.5|1112484580|
|     1|    112|   3.5|1094785740|
|     1|    151|   4.0|1094785734|
|     1|    223|   4.0|1112485573|
|     1|    253|   4.0|1112484940|
|     1|    260|   4.0|1112484826|
|     1|    293|   4.0|1112484703|
|     1|    296|   4.0|1112484767|
|     1|    318|   4.0|1112484798|
|     1|    337|   3.5|1094785709|
|     1|    367|   3.5|1112485980|
|     1|    541|   4.0|1112484603|
|     1|    589|   3.5|1112485557|
|     1|    593|   3.5|1112484661|
|     1|    653|   3.0|1094785691|
|     1|    919|   3.5|1094785621|
+------+-------+------+----------+
only showing the top 20 rows
As shown in the last column, the timestamp shows the epoch date. In the following example,
- convert the epoch time to regular string (line# 3)
- convert string to timestamp (line# 4)
You can print the schema as shown in line# 7.
from pyspark.sql.functions import from_unixtime, to_timestamp

ratings_1_df=ratings_df.withColumn('rating_date',from_unixtime('timestamp',"MM/dd/yyyy hh:mm:ss a")) \
    .withColumn('rating_date',to_timestamp('rating_date',"MM/dd/yyyy hh:mm:ss a")) \
    .drop('timestamp')

ratings_1_df.printSchema()
root
 |-- userId: integer (nullable = true)
 |-- movieId: integer (nullable = true)
 |-- rating: float (nullable = true)
 |-- rating_date: timestamp (nullable = true)
NOTE: Even you can drop the original
timestampcolumn after the
transformation.
For example, calculate the average rating for each movie and show the top 5 movie ids. The avg function has been used in line# 5.
from pyspark.sql.functions import avg

ratings_1_df.select("movieId",'rating') \
    .groupBy('movieId') \
    .avg('rating').orderBy('avg(rating)', ascending=False).show(5)
[Stage 77:==============>                                          (3 + 9) / 12]


+-------+-----------+
|movieId|avg(rating)|
+-------+-----------+
| 129530|        5.0|
| 119430|        5.0|
|  89133|        5.0|
| 101292|        5.0|
|  88488|        5.0|
+-------+-----------+
only showing top 5 rows
Spark SQL
You can register DataFrame as a temporary view.
ratings_1_df.createOrReplaceTempView('ratings_tbl')
Now you can query the view using SQL. For example, in the following code, we can order the records on rating_date with the first one to be the latest rating.
spark.sql('SELECT * FROM ratings_tbl ORDER BY rating_date DESC').show(5)
[Stage 3:========================>                                 (5 + 7) / 12]


+------+-------+------+-------------------+
|userId|movieId|rating|        rating_date|
+------+-------+------+-------------------+
| 85523| 149406|   4.5|2019-11-21 20:15:03|
|  8642| 122914|   4.0|2019-11-21 20:12:29|
| 85523| 204704|   4.0|2019-11-21 20:12:13|
|  8642| 202101|   2.0|2019-11-21 20:11:52|
| 85523| 168252|   4.0|2019-11-21 20:11:19|
+------+-------+------+-------------------+
only showing top 5 rows
Let's register the movies as well. The target is to join the movies and rating.
movies_schema = '`movieId` INT, `title` STRING, `genres` STRING'
movies_df = spark.read.format('csv') \
    .option('header', True) \
        .schema(movies_schema) \
            .load('/Users/ojitha/datasets/ml-25m/movies.csv')

movies_df.createOrReplaceTempView('movies_tbl')
spark.sql('SELECT * from movies_tbl').show(5)
+-------+--------------------+--------------------+
|movieId|               title|              genres|
+-------+--------------------+--------------------+
|      1|    Toy Story (1995)|Adventure|Animati...|
|      2|      Jumanji (1995)|Adventure|Childre...|
|      3|Grumpier Old Men ...|      Comedy|Romance|
|      4|Waiting to Exhale...|Comedy|Drama|Romance|
|      5|Father of the Bri...|              Comedy|
+-------+--------------------+--------------------+
only showing top 5 rows
Now you can write the SQL to find the top 10 rated movies:
top_movies_df = spark.sql("""
-- Find the to 10 movies
-- This is not the best optimized query as well
SELECT m.title, avg(r.rating) as avarage_rating FROM ratings_tbl r
JOIN movies_tbl m ON r.movieId = m.movieId
GROUP BY m.movieId, m.title ORDER BY avarage_rating DESC;
""")
top_movies_df.show(10, truncate=False)
[Stage 20:=========>                                              (2 + 10) / 12]


+----------------------------------------------------+--------------+
|title                                               |avarage_rating|
+----------------------------------------------------+--------------+
|The Ties That Bind (2015)                           |5.0           |
|Von einem, der auszog, das Fürchten zu lernen (2014)|5.0           |
|El camino (2008)                                    |5.0           |
|Day of the Panther (1988)                           |5.0           |
|Anybody's Son Will Do                               |5.0           |
|White Room (1990)                                   |5.0           |
|The Defiant Ones (1986)                             |5.0           |
|L'Isola di Medea (2016)                             |5.0           |
|Sing (1989)                                         |5.0           |
|Latin Music USA (2009)                              |5.0           |
+----------------------------------------------------+--------------+
only showing top 10 rows
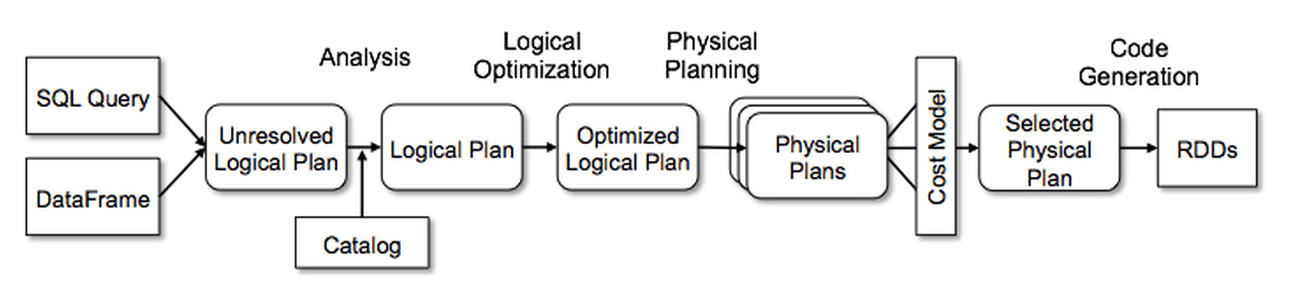
There are 4 stages to go through:
- Analysis
- Logical optimisation
- Physical planning
- Code generation
The Catalyst optimiser takes a computational query and converts it into an execution plan. It goes through four transformational phases4.
top_movies_df.explain(True)
== Parsed Logical Plan ==
'Sort ['avarage_rating DESC NULLS LAST], true
+- 'Aggregate ['m.movieId, 'm.title], ['m.title, 'avg('r.rating) AS avarage_rating#244]
   +- 'Join Inner, ('r.movieId = 'm.movieId)
      :- 'SubqueryAlias r
      :  +- 'UnresolvedRelation [ratings_tbl], [], false
      +- 'SubqueryAlias m
         +- 'UnresolvedRelation [movies_tbl], [], false

== Analyzed Logical Plan ==
title: string, avarage_rating: double
Sort [avarage_rating#244 DESC NULLS LAST], true
+- Aggregate [movieId#120, title#121], [title#121, avg(rating#2) AS avarage_rating#244]
   +- Join Inner, (movieId#1 = movieId#120)
      :- SubqueryAlias r
      :  +- SubqueryAlias ratings_tbl
      :     +- View (`ratings_tbl`, [userId#0,movieId#1,rating#2,rating_date#35])
      :        +- Project [userId#0, movieId#1, rating#2, rating_date#35]
      :           +- Project [userId#0, movieId#1, rating#2, timestamp#3, to_timestamp('rating_date, Some(MM/dd/yyyy hh:mm:ss a)) AS rating_date#35]
      :              +- Project [userId#0, movieId#1, rating#2, timestamp#3, from_unixtime(cast(timestamp#3 as bigint), MM/dd/yyyy hh:mm:ss a, Some(Australia/Sydney)) AS rating_date#29]
      :                 +- Relation [userId#0,movieId#1,rating#2,timestamp#3] csv
      +- SubqueryAlias m
         +- SubqueryAlias movies_tbl
            +- View (`movies_tbl`, [movieId#120,title#121,genres#122])
               +- Relation [movieId#120,title#121,genres#122] csv

== Optimized Logical Plan ==
Sort [avarage_rating#244 DESC NULLS LAST], true
+- Aggregate [movieId#120, title#121], [title#121, avg(rating#2) AS avarage_rating#244]
   +- Project [rating#2, movieId#120, title#121]
      +- Join Inner, (movieId#1 = movieId#120)
         :- Project [movieId#1, rating#2]
         :  +- Filter isnotnull(movieId#1)
         :     +- Relation [userId#0,movieId#1,rating#2,timestamp#3] csv
         +- Project [movieId#120, title#121]
            +- Filter isnotnull(movieId#120)
               +- Relation [movieId#120,title#121,genres#122] csv

== Physical Plan ==
AdaptiveSparkPlan isFinalPlan=false
+- Sort [avarage_rating#244 DESC NULLS LAST], true, 0
   +- Exchange rangepartitioning(avarage_rating#244 DESC NULLS LAST, 200), ENSURE_REQUIREMENTS, [id=#628]
      +- HashAggregate(keys=[movieId#120, title#121], functions=[avg(rating#2)], output=[title#121, avarage_rating#244])
         +- Exchange hashpartitioning(movieId#120, title#121, 200), ENSURE_REQUIREMENTS, [id=#625]
            +- HashAggregate(keys=[movieId#120, title#121], functions=[partial_avg(rating#2)], output=[movieId#120, title#121, sum#256, count#257L])
               +- Project [rating#2, movieId#120, title#121]
                  +- BroadcastHashJoin [movieId#1], [movieId#120], Inner, BuildRight, false
                     :- Filter isnotnull(movieId#1)
                     :  +- FileScan csv [movieId#1,rating#2] Batched: false, DataFilters: [isnotnull(movieId#1)], Format: CSV, Location: InMemoryFileIndex(1 paths)[file:/Users/ojitha/datasets/ml-25m/ratings.csv], PartitionFilters: [], PushedFilters: [IsNotNull(movieId)], ReadSchema: struct<movieId:int,rating:float>
                     +- BroadcastExchange HashedRelationBroadcastMode(List(cast(input[0, int, false] as bigint)),false), [id=#620]
                        +- Filter isnotnull(movieId#120)
                           +- FileScan csv [movieId#120,title#121] Batched: false, DataFilters: [isnotnull(movieId#120)], Format: CSV, Location: InMemoryFileIndex(1 paths)[file:/Users/ojitha/datasets/ml-25m/movies.csv], PartitionFilters: [], PushedFilters: [IsNotNull(movieId)], ReadSchema: struct<movieId:int,title:string>
End the spark sesstion
spark.stop()
Continue to the second part5 ...
References
-
PySpark environment for the Postgres database, https://ojitha.blogspot.com/2022/02/pyspark-environment-for-postgres.html ↩
-
PostgreSQL Sample Database, https://www.postgresqltutorial.com/postgresql-sample-database/ ↩
-
recommended for new research, https://grouplens.org/datasets/movielens/ ↩
-
Chapter 3 Apache Spark's Structured APIs| Learning Spark, 2nd Edition, https://learning.oreilly.com/library/view/learning-spark-2nd/9781492050032/ch03.html#when_to_use_rdds ↩
-
Spark SQL using Hive metastore, https://ojitha.blogspot.com/2022/02/spark-sql-using-hive-metastore.html ↩


Comments
Post a Comment
commented your blog